Part 01
A brief history of heavy metals

Your blood carries far less lead than it did in 1980. So why are we more afraid of carrots than our grandparents were of lead paint?
From lead paint chips to trace parts per billion (ppb) in cookies, exposure to heavy metals has decreased in recent decades. The real story arc here isn’t rising danger — it’s unprecedented progress.
From 1976 to 1980, the average American’s blood contained about 12.8 micrograms of lead per deciliterOpens in a new tab (µg/dL), roughly three and a half times today’s reference value of 3.5 µg/dL.Opens in a new tab Thanks to decades of regulation, median blood lead levels in young children have dropped 95% in a generationOpens in a new tab. Yet we worry more about trace metals in everyday foods than our grandparents did about lead paint.
Science keeps improving its ability to detect trace substances, but public understanding hasn’t kept pace.
Let’s break down how heavy metal testing has evolved — and what those measurements actually mean — so you can make sense of the scope when seeing toxicology reports (like the panic over protein powdersOpens in a new tab not too long ago) make the news.
Heavy Metal Exposure in the Past vs. Today
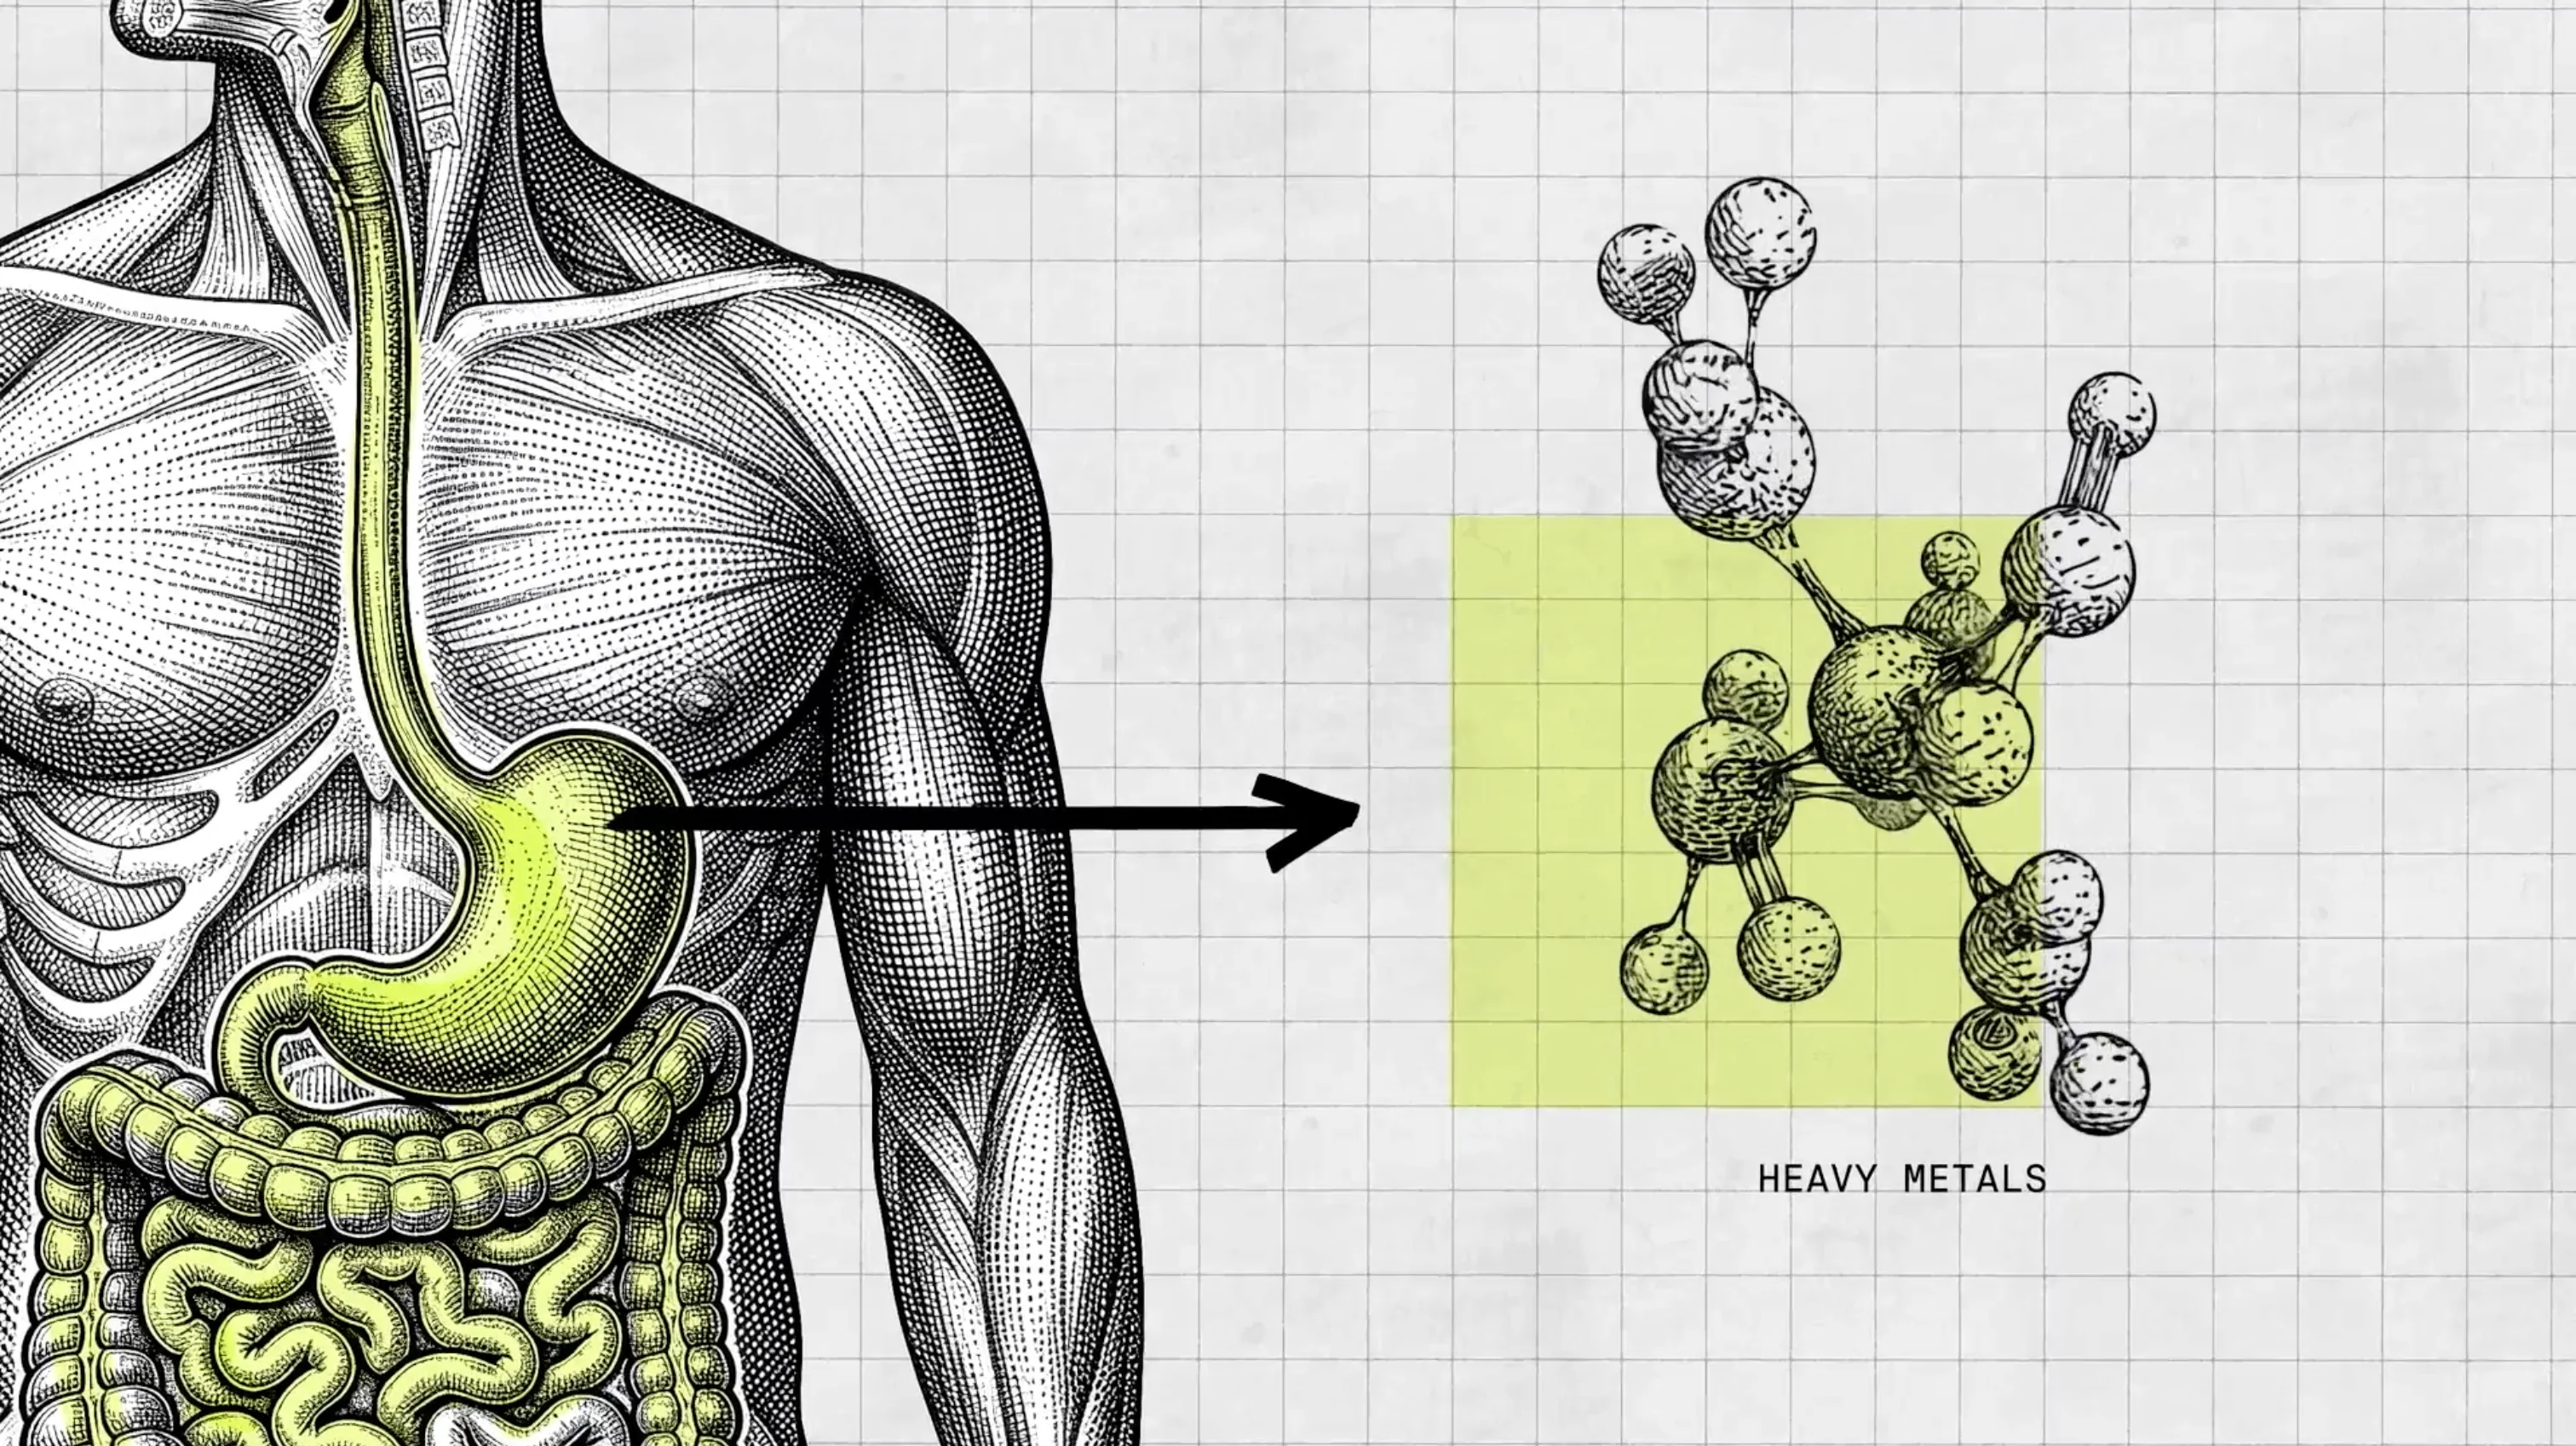
Lead, mercury, arsenic, and cadmium are naturally occurring elements — part of the Earth’s crust, air, and water. But human use amplified our exposure:
- Early medicines and cosmetics used mercury and arsenic for their perceived healingOpens in a new tab — to treat everything from blemishes to snake bites.
- The Industrial Revolution brought cadmiumOpens in a new tab runoff from mining.
- The early 20th century expanded the problem with leaded gasoline and lead-based paintsOpens in a new tab.
Practices like these caused environmental and health disasters, including Minamata BayOpens in a new tab in Japan (mercury poisoning), “Itai-itai” diseaseOpens in a new tab in Japan (cadmium poisoning), arsenic-tainted wellsOpens in a new tab in Bangladesh that affected millions, and perhaps most well-known, the Flint, Michigan water crisisOpens in a new tab that exposed tens of thousands of residents to elevated lead levels in drinking water.
By 1980, we finally had national-scale data to quantify the lead crisis. The Second National Health and Nutrition Examination Survey measuredOpens in a new tab an average U.S. blood-lead level of 12.8 µg/dL with more than one in five young childrenOpens in a new tab exceeding 20 µg/dL — confirming how widespread the exposure really was across the country.
When Heavy Metal Regulation Started Working
From the late 1960s into the 1990s, researchers such as Herbert Needleman, M.D.Opens in a new tab observed an association between elevated lead levels and impaired cognitive and behavioral development. It added to a growing awareness of lead’s broader health hazardsOpens in a new tab that drove decades of regulation.
These findings reframed lead as a developmental toxin rather than a benign industrial material, which spurred a wave of regulatory action:
- 1970 - Clean Air Act: Empowered the EPA to regulate airborne contaminants, setting the foundation for the phase-out of lead gasoline (completed in 1996). This contributed to declining blood-lead levelsOpens in a new tab across the US.
- 1978 - Consumer Product Safety Commission ban: This ban on lead-based paint, which prohibited the sale of residential paint containing more than 0.06% lead by weight,Opens in a new tab a primary source of exposure for children. As a result, homes built after 1978 have dramatically lower lead hazard levelsOpens in a new tab, and children in newer homes have lower blood-lead levels overallOpens in a new tab.
- 1986 - Safe Drinking Water Act AmendmentsOpens in a new tab and 1991 Lead and Copper RuleOpens in a new tab: These regulations collectively limited lead in plumbing materials and set strict thresholds for water system lead content. After these rules took effect, tap water lead levels dropped substantiallyOpens in a new tab across US water systems.
- 1990s–2000s - Strengthened food safety oversight: FDA actionsOpens in a new tab limited lead in foods and packaging. Many companies voluntarily stopped using lead cans in the 1970s, which dramatically decreased dietary lead exposureOpens in a new tab.
The takeaway: Targeted, evidence-based regulation works.
Now, population blood lead levels are monitored through the ongoing NHANES survey program.
NHANES recruits new samples of people across the U.S. Each year, thousands of participants complete interviews, physical examinations, and laboratory testing, including blood lead measurement for eligible participants. Complex sampling and statistical weighting are used to produce nationally representative estimates.
That means we’re not guessing whether Americans’ lead exposure has risen or fallen based only on environmental measurements or food testing. We can look at how much lead is showing up in people’s blood and track changes over decades.
Why Testing Shows More “Problems” Now: Modern Detection and Misunderstanding
So why does it feel like heavy metals are everywhere? Because modern testing can see almost everything.
Today’s instruments can detect elements in parts per billion — with one part per billion being the equivalent of a single drop in an Olympic-sized pool. That precision is a major win for safety monitoring but also a recipe for misunderstanding.
It started in the 1970s when toxicologist Dr. Bruce Ames developed a test so sensitive it could detect mutagens in everyday foods like coffeeOpens in a new tab. People misinterpreted this to believe that coffee causes cancer. Ames had to clarifyOpens in a new tab that detection did not equal danger and that science’s ability to measure something doesn’t automatically make it meaningful.
Fast forward to today’s information age, and misinformation spreads faster than facts. A single headline, TikTok clip, or infographic can ignite national (and even international) panic before experts have time to explain what the data mean. Detection technology has outpaced science literacy, and fear often fills the gap.
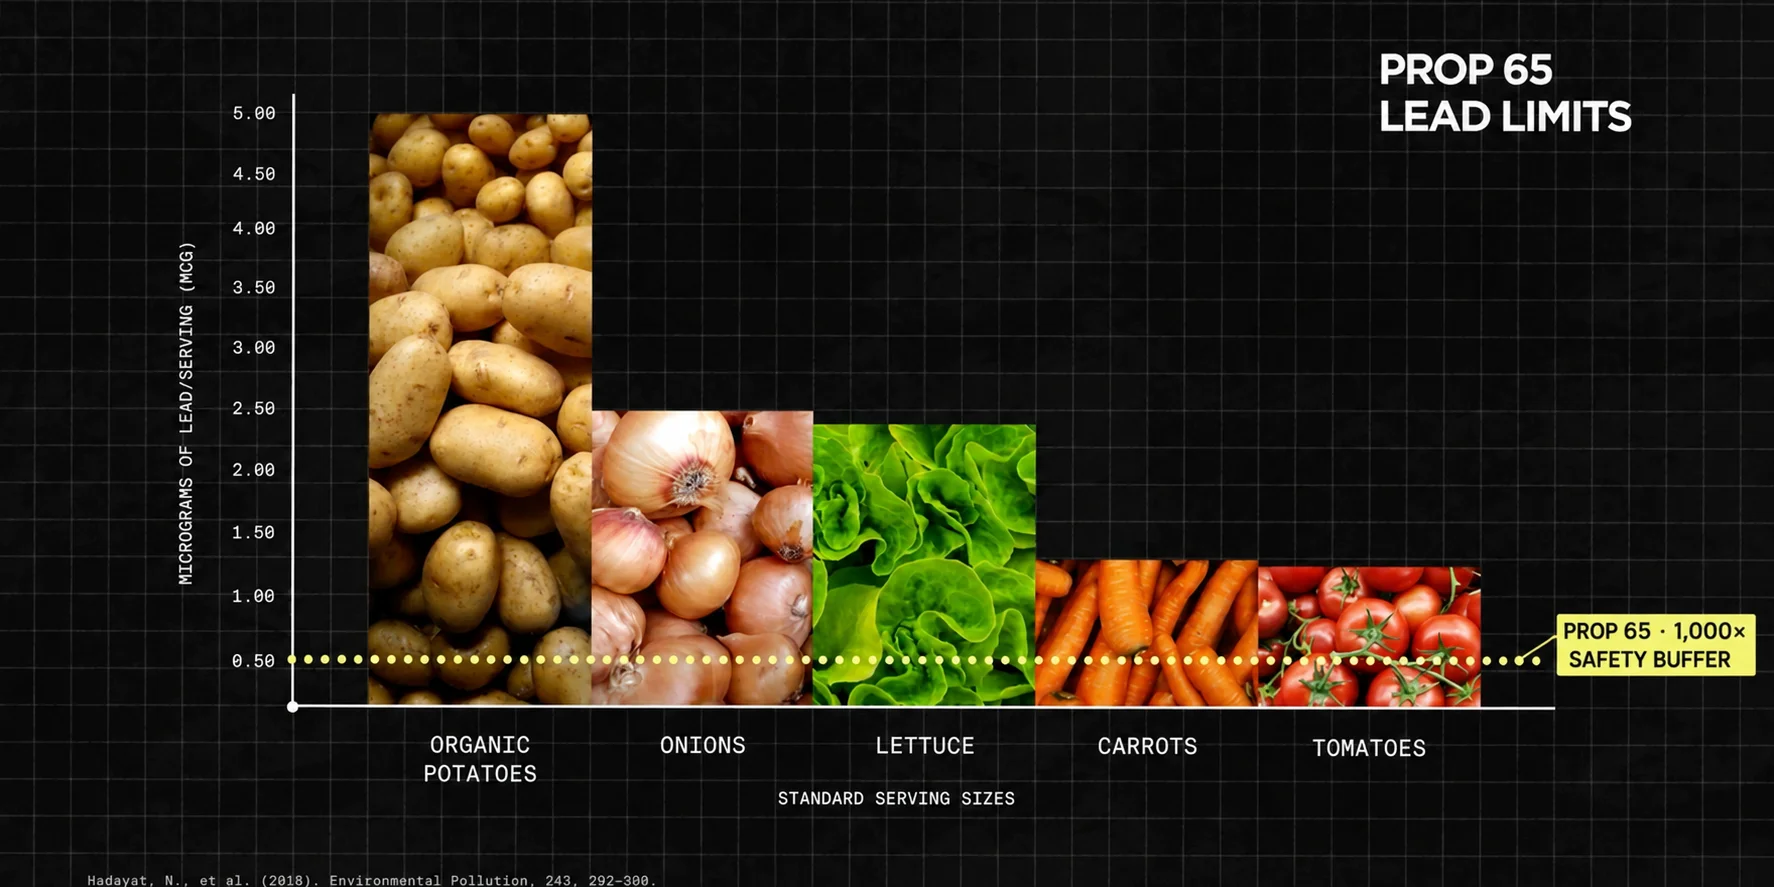
That’s why trace findings often sound alarming — because the numbers are missing context. For example, a two-cookie serving with 1 microgram (µg) of leadOpens in a new tab may seem worrisome until you learn that a medium carrot contains 1.7 mcgOpens in a new tab and a medium potato has 2.4 mcgOpens in a new tab, simply because plants naturally absorb minerals from soil. To put that in perspective, a microgram is about the size of one bacterial cell — invisible to the naked eye.
The presence of heavy metals in parts per billion doesn’t imply harm. Toxicity depends on dose, exposure, bioavailability, and your body’s own ability to metabolize and excrete substances. It also depends on a person’s individual susceptibility — children and pregnant women are particularly vulnerable.
When Heavy Metal Safety Standards Don’t Reflect Science
Modern food and environmental safety programs should continue refining how we monitor contaminants, but not all standards are created equal.
Take California’s Proposition 65Opens in a new tab: It was originally designed to protect drinking water from industrial contamination, then was later applied to foods and packaged goods without accounting for bioavailability — how much of a substance your body absorbs.
The result? Proposition 65 requires the “no observable effect level” to be divided by 1,000Opens in a new tab in order to provide an ample margin of safety. The limit is so strict it flags even trace amounts naturally found in natural foods.
Prop 65 isn’t recognized by the FDA or EPA as a federal safety standard, and while its intent may be protective, its limits often don’t reflect toxicological reality.
In truth, if you eat whole foods like vegetables, grains, or meats, you’re already consuming more than a microgram of lead a day — another reminder that detection isn’t danger.
| Vegetable | Organic (mcg/kg) | Conventional (mcg/kg) | Amount per standard serving of conventional |
|---|---|---|---|
| Tomato | 5.0 | 7.7 | ~1.1 mcg per 1 medium tomato |
| Lettuce | 12.0 | 25.3 | ~2.2 mcg per 1.5 cups of chopped lettuce |
| Onion | 3.0 | 19.0 | ~2.8 mcg per 1 medium onion |
| Carrot | 7.2 | 22.4 | ~1.8 mcg per 1 medium carrot |
| Potato | 32.6 | 16.5 | ~2.4 mcg per 1 medium potato |
Are We Safer From Heavy Metals Today?
There was a time when metal toxicity was a genuine public-health threat. Leaded gasoline, lead-based paint, and industrial discharge were not abstract risks; they were widespread, persistent exposures with real consequences.
We have largely won that battle. Those major sources have been dramatically reduced or eliminated in the United States, and the result is a generational drop in exposure to leadOpens in a new tab.
Today, what remains is largely trace amounts that have always existed in the natural world, and their continued detection is a sign of progress, not regression. Our bodies are not passive vessels, either; they’re equipped with robust systemsOpens in a new tab that process and clear many compounds safely, including trace heavy metals naturally found in foods, drinks, and household items. Of course, your body’s ability to eliminate heavy metals will vary based on the exact metal and your level of exposure.
We are, in many ways, safer than ever.
The real progress story isn’t hidden in trace detections, it’s in decades of data that prove science-backed regulations have drastically reduced real risk.
You’re safer from heavy metals than your great-grandparents ever were.